THE VERIFIED REPORT
The Verified Report, page by page.
One document with what was measured, what was changed and what the measurements support. Below is a sample: illustrative figures, not a real client.
Both versions open in a new tab. Download saves the light, print-friendly version.
00The sample summary, in HTML
EXAMPLE DATA Illustrative figures for the format and the verdict logic, not measurements from a real client.
VERDICT · AVR-2026-0001 · 2026-07-04
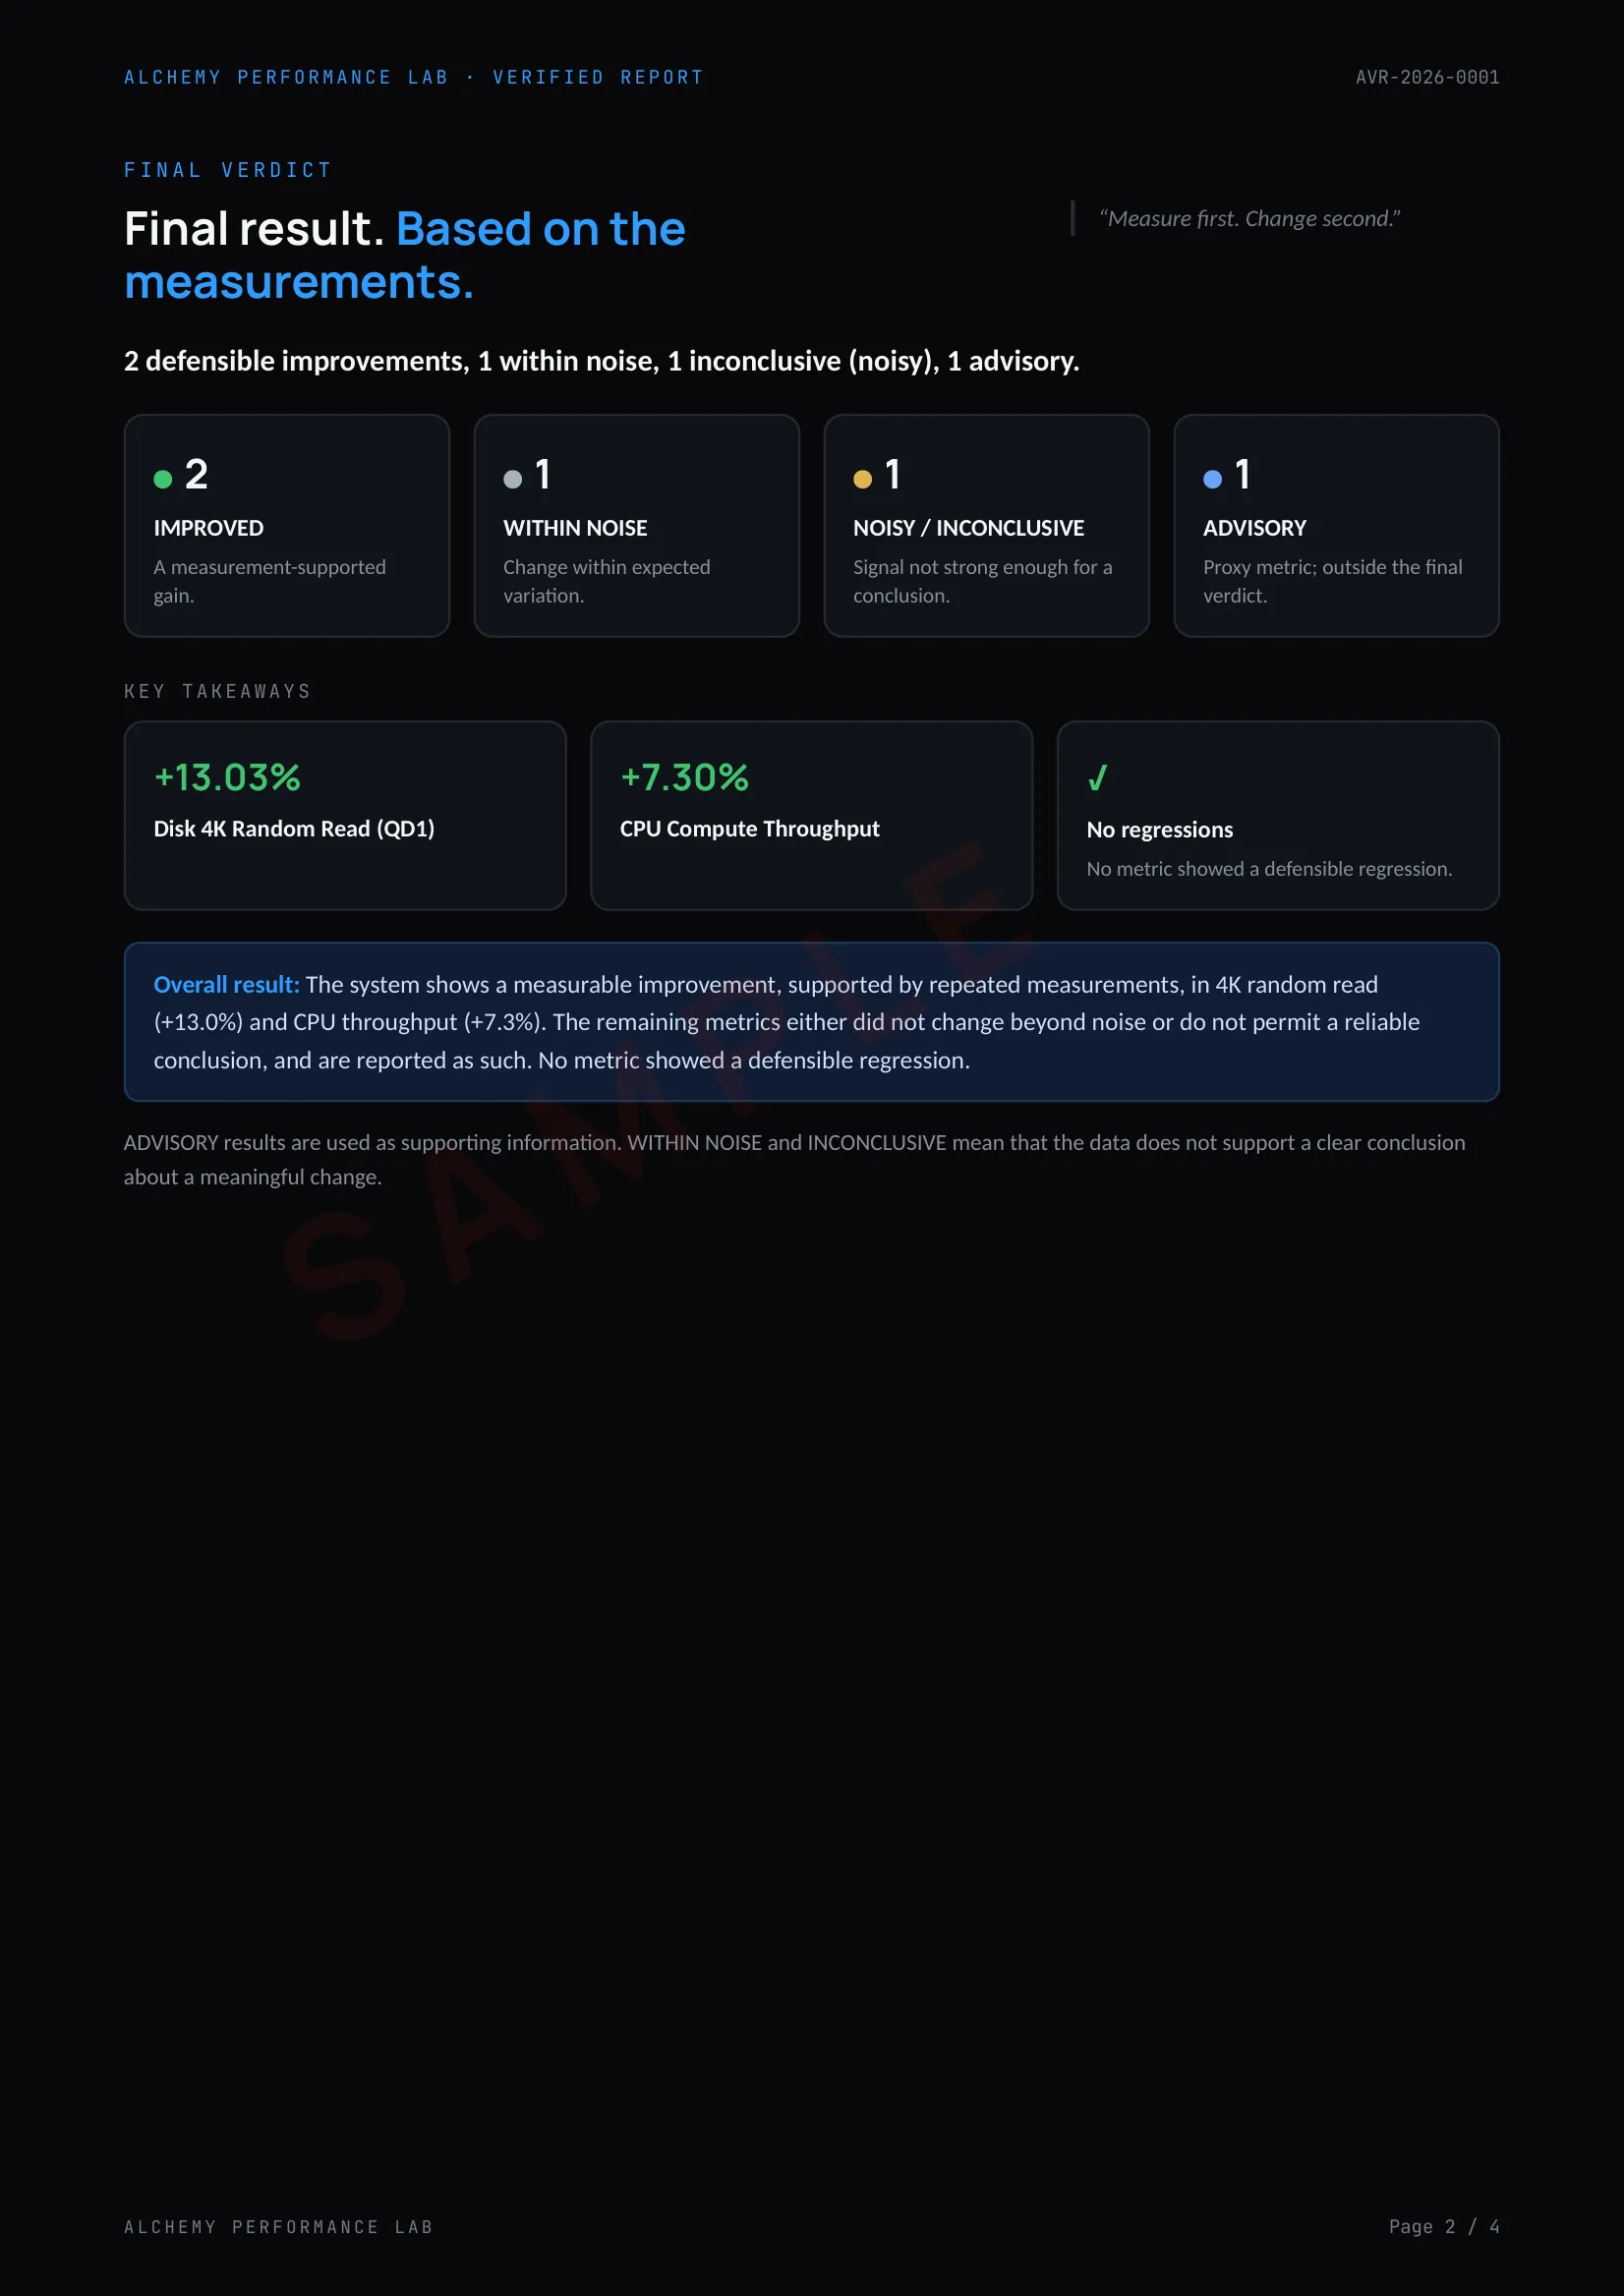
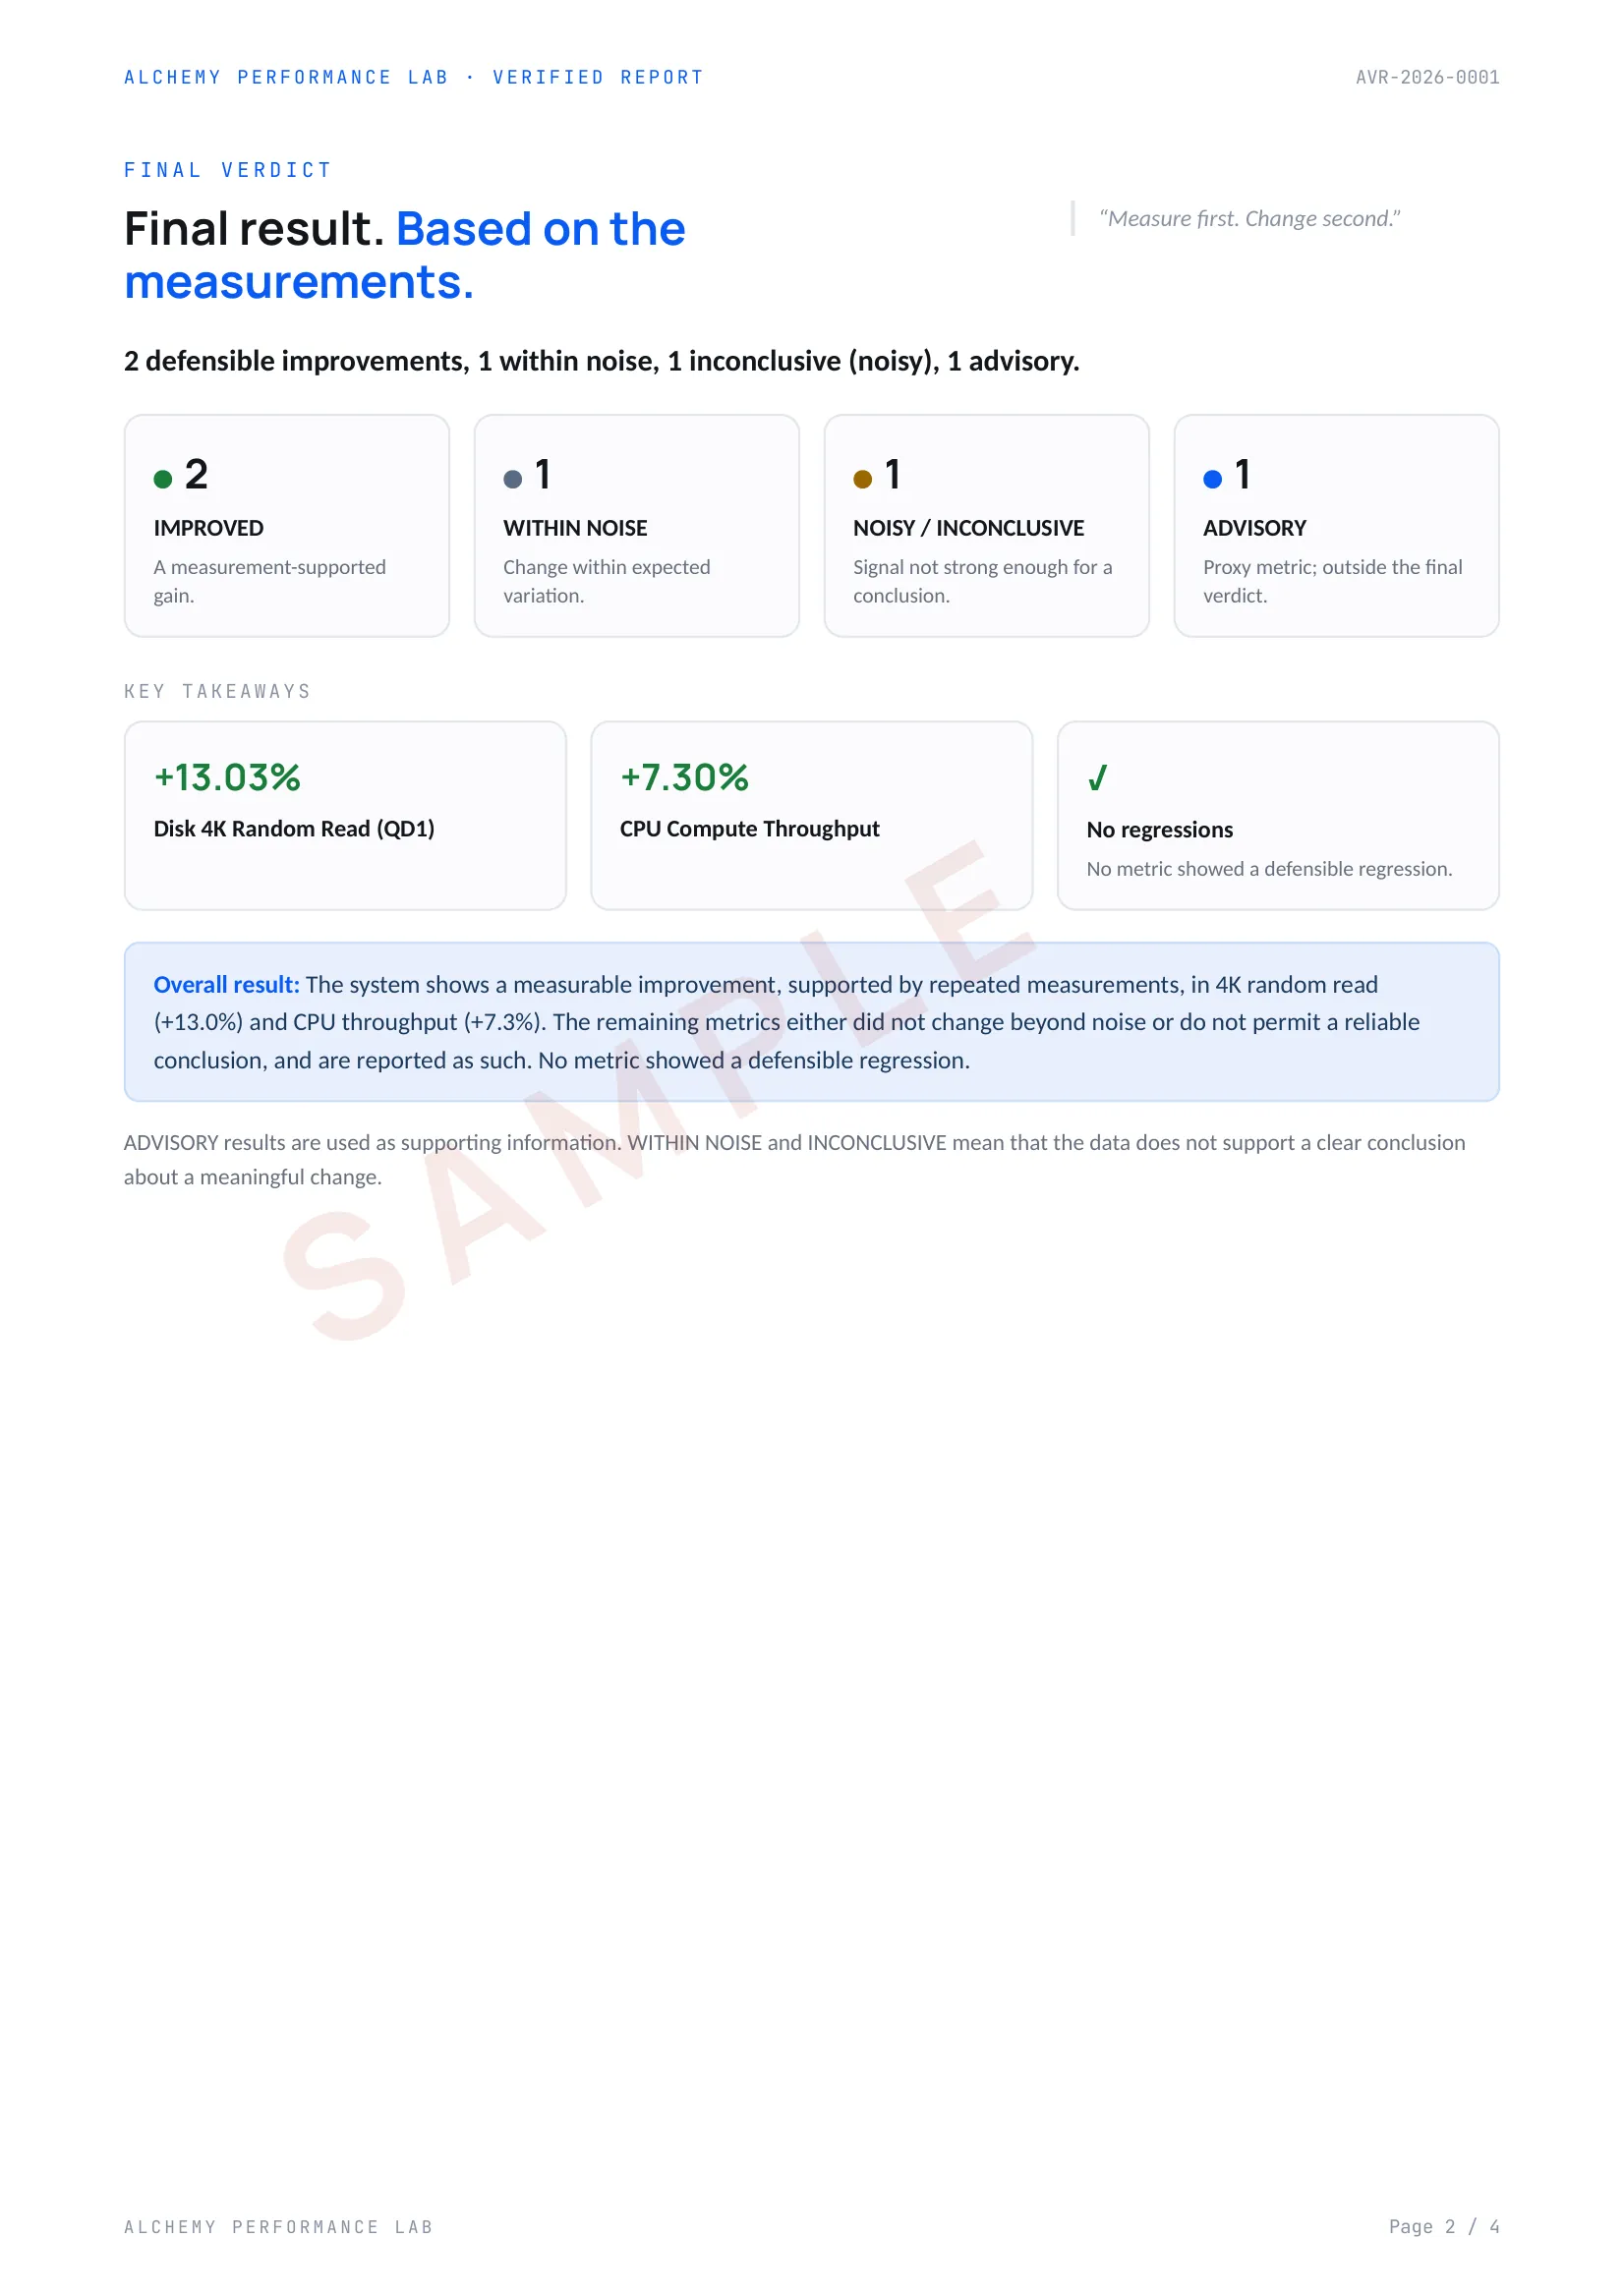
2 defensible improvements, 1 within noise, 1 inconclusive (noisy), 1 advisory.
The system shows a measurable improvement, supported by repeated measurements, in 4K random read (+13.0%) and CPU throughput (+7.3%). The remaining metrics either did not change beyond noise or do not permit a reliable conclusion, and are reported as such. No metric showed a defensible regression.
| Metric | Before | After | Δ% | Verdict |
|---|---|---|---|---|
| Disk Sequential Read (MB/s) | 2,431.5 | 2,448.1 | +0.68% | WITHIN NOISE |
| Disk 4K Random Read (QD1) (MB/s) | 46.8 | 52.9 | +13.03% | IMPROVED |
| Disk Write Latency (avg) (ms) | 0.412 | 0.395 | -4.13% | NOISY / INCONCLUSIVE |
| CPU Compute Throughput (ops/s) | 184,200 | 197,650 | +7.3% | IMPROVED |
| Responsiveness Proxy (jitter window) (ms) | 1.86 | 1.52 | -18.28% | ADVISORY |
Per-metric details, system and conditions
Disk Sequential Read: The difference clears neither the variation threshold nor the practical floor: no defensible change.
Disk 4K Random Read (QD1): Clear improvement, several times the noise band.
Disk Write Latency (avg): Inherent instability (CV > 5%) on both sides; the nominal improvement is not reliably supported.
CPU Compute Throughput: Consistent improvement, compatible with the power management changes.
Responsiveness Proxy (jitter window): Proxy metric, reported as advisory and not weighed equally in the final verdict.
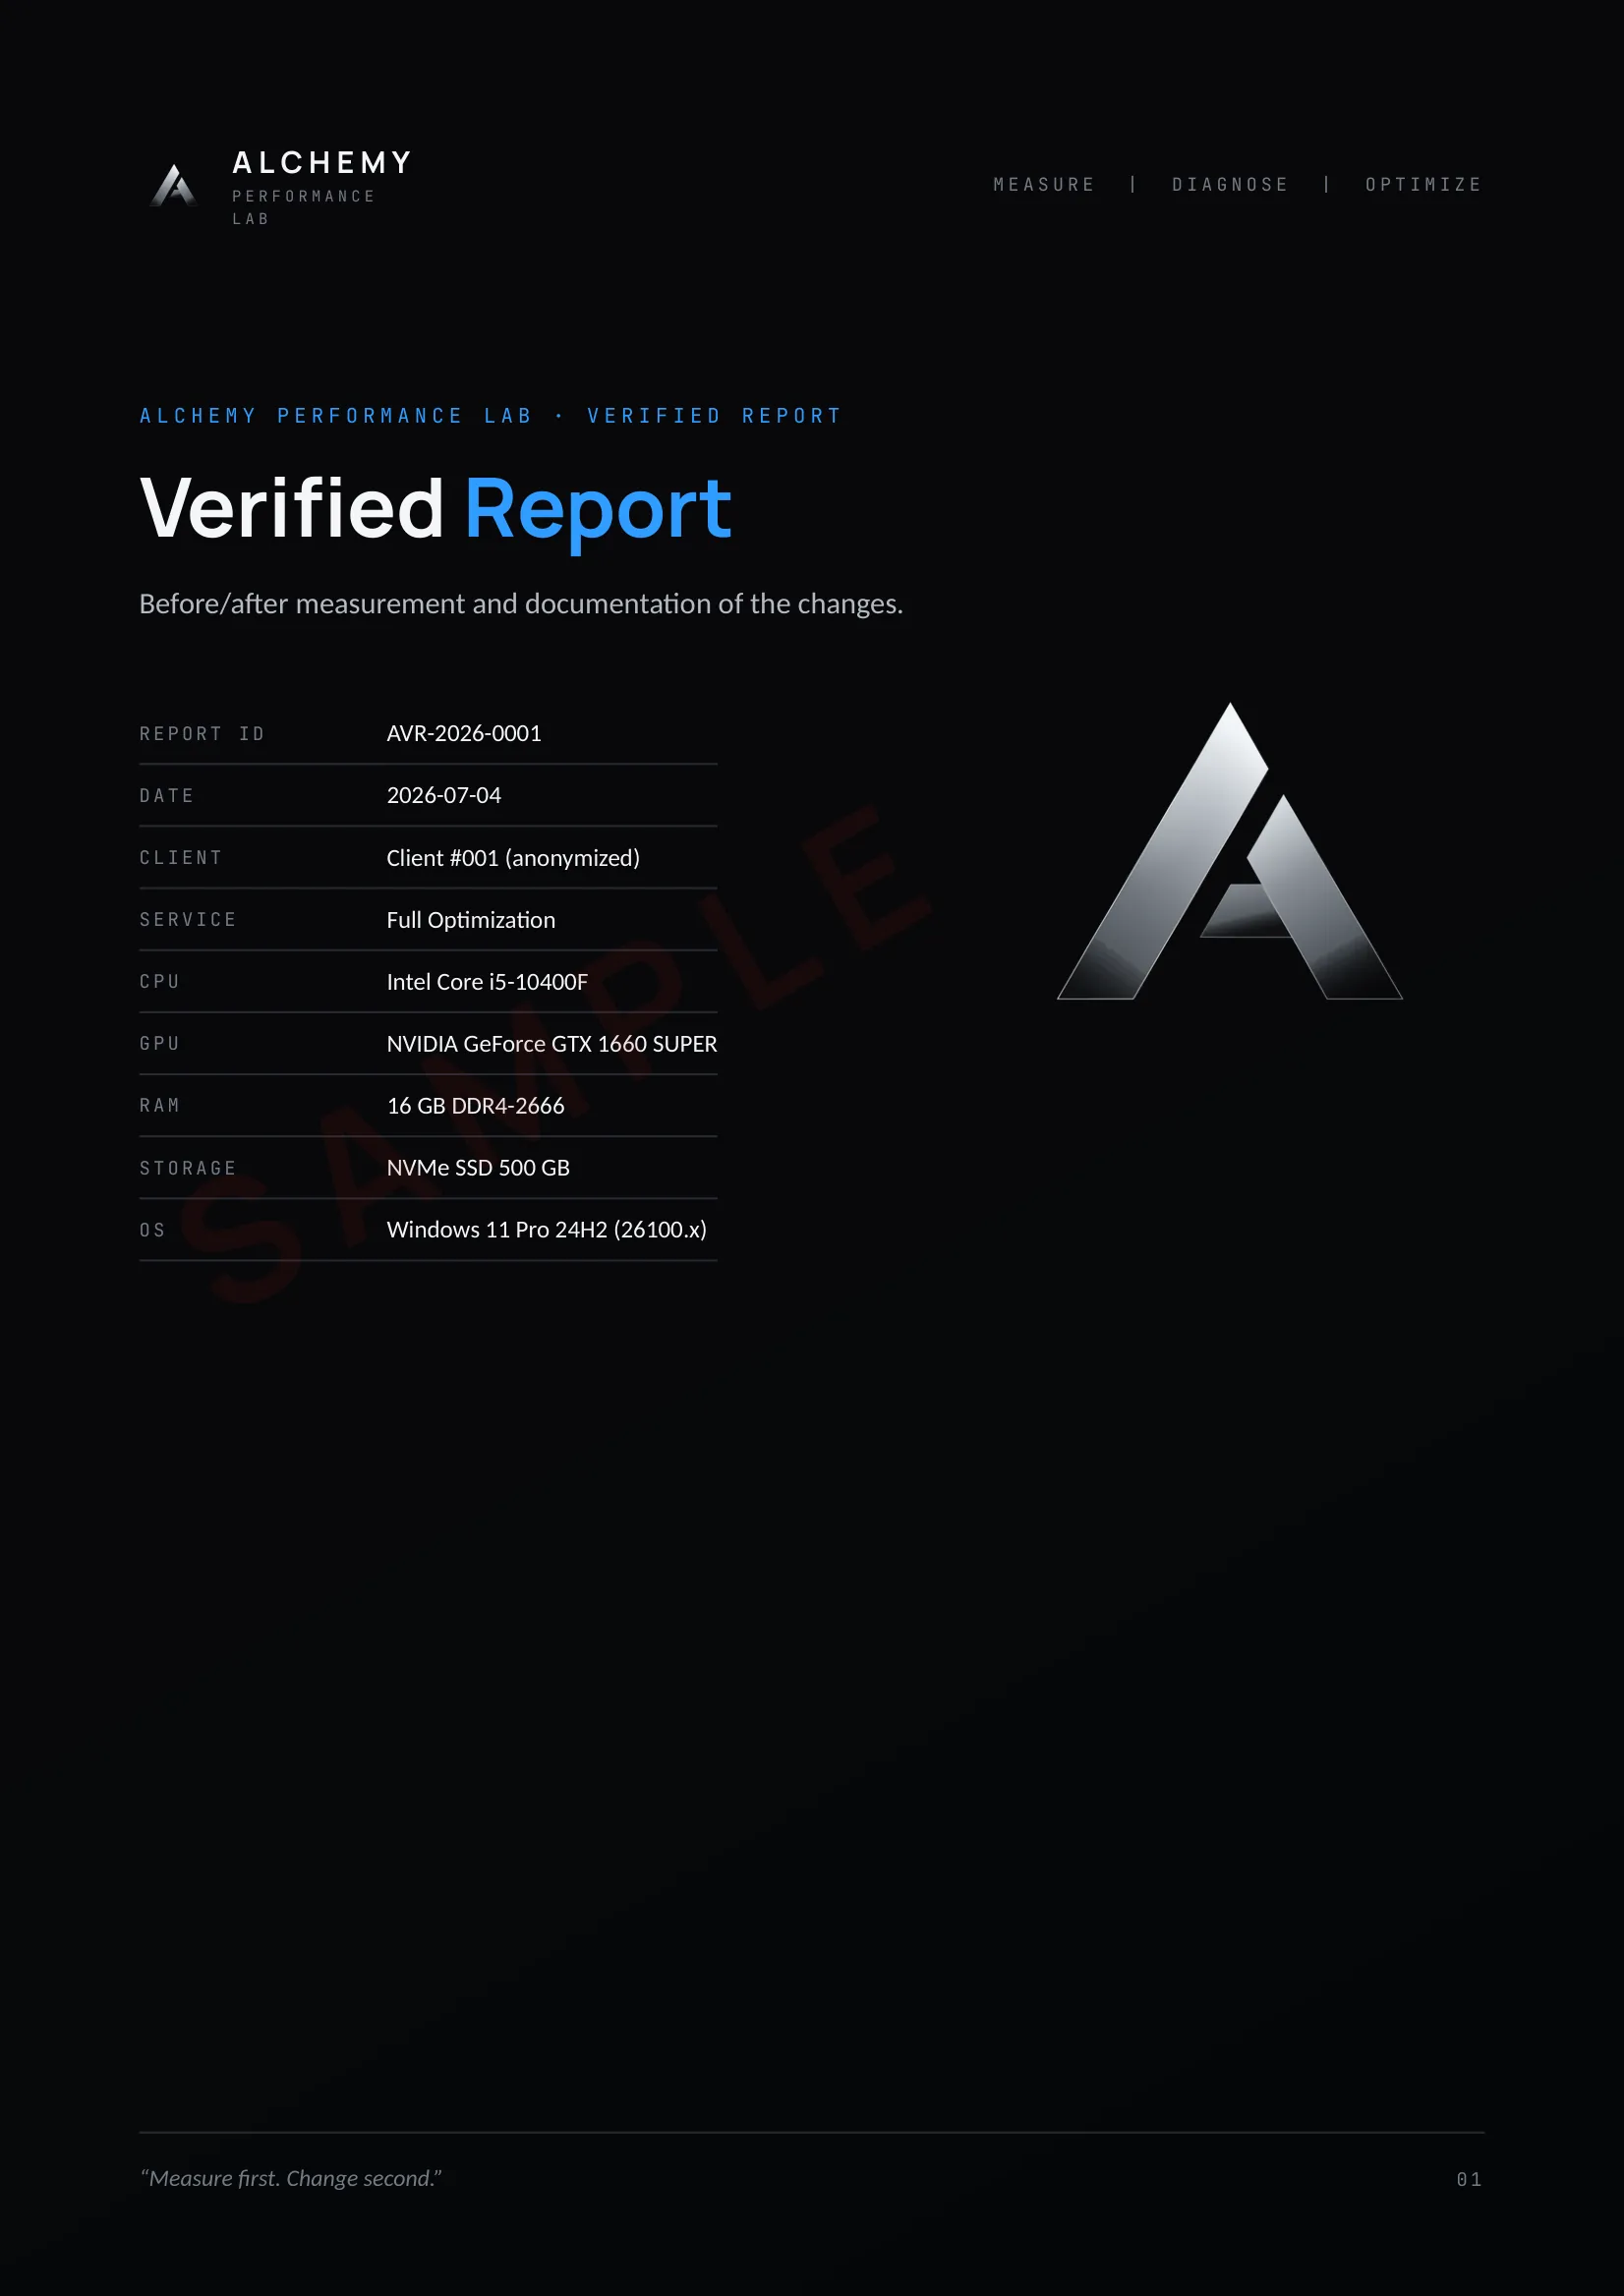
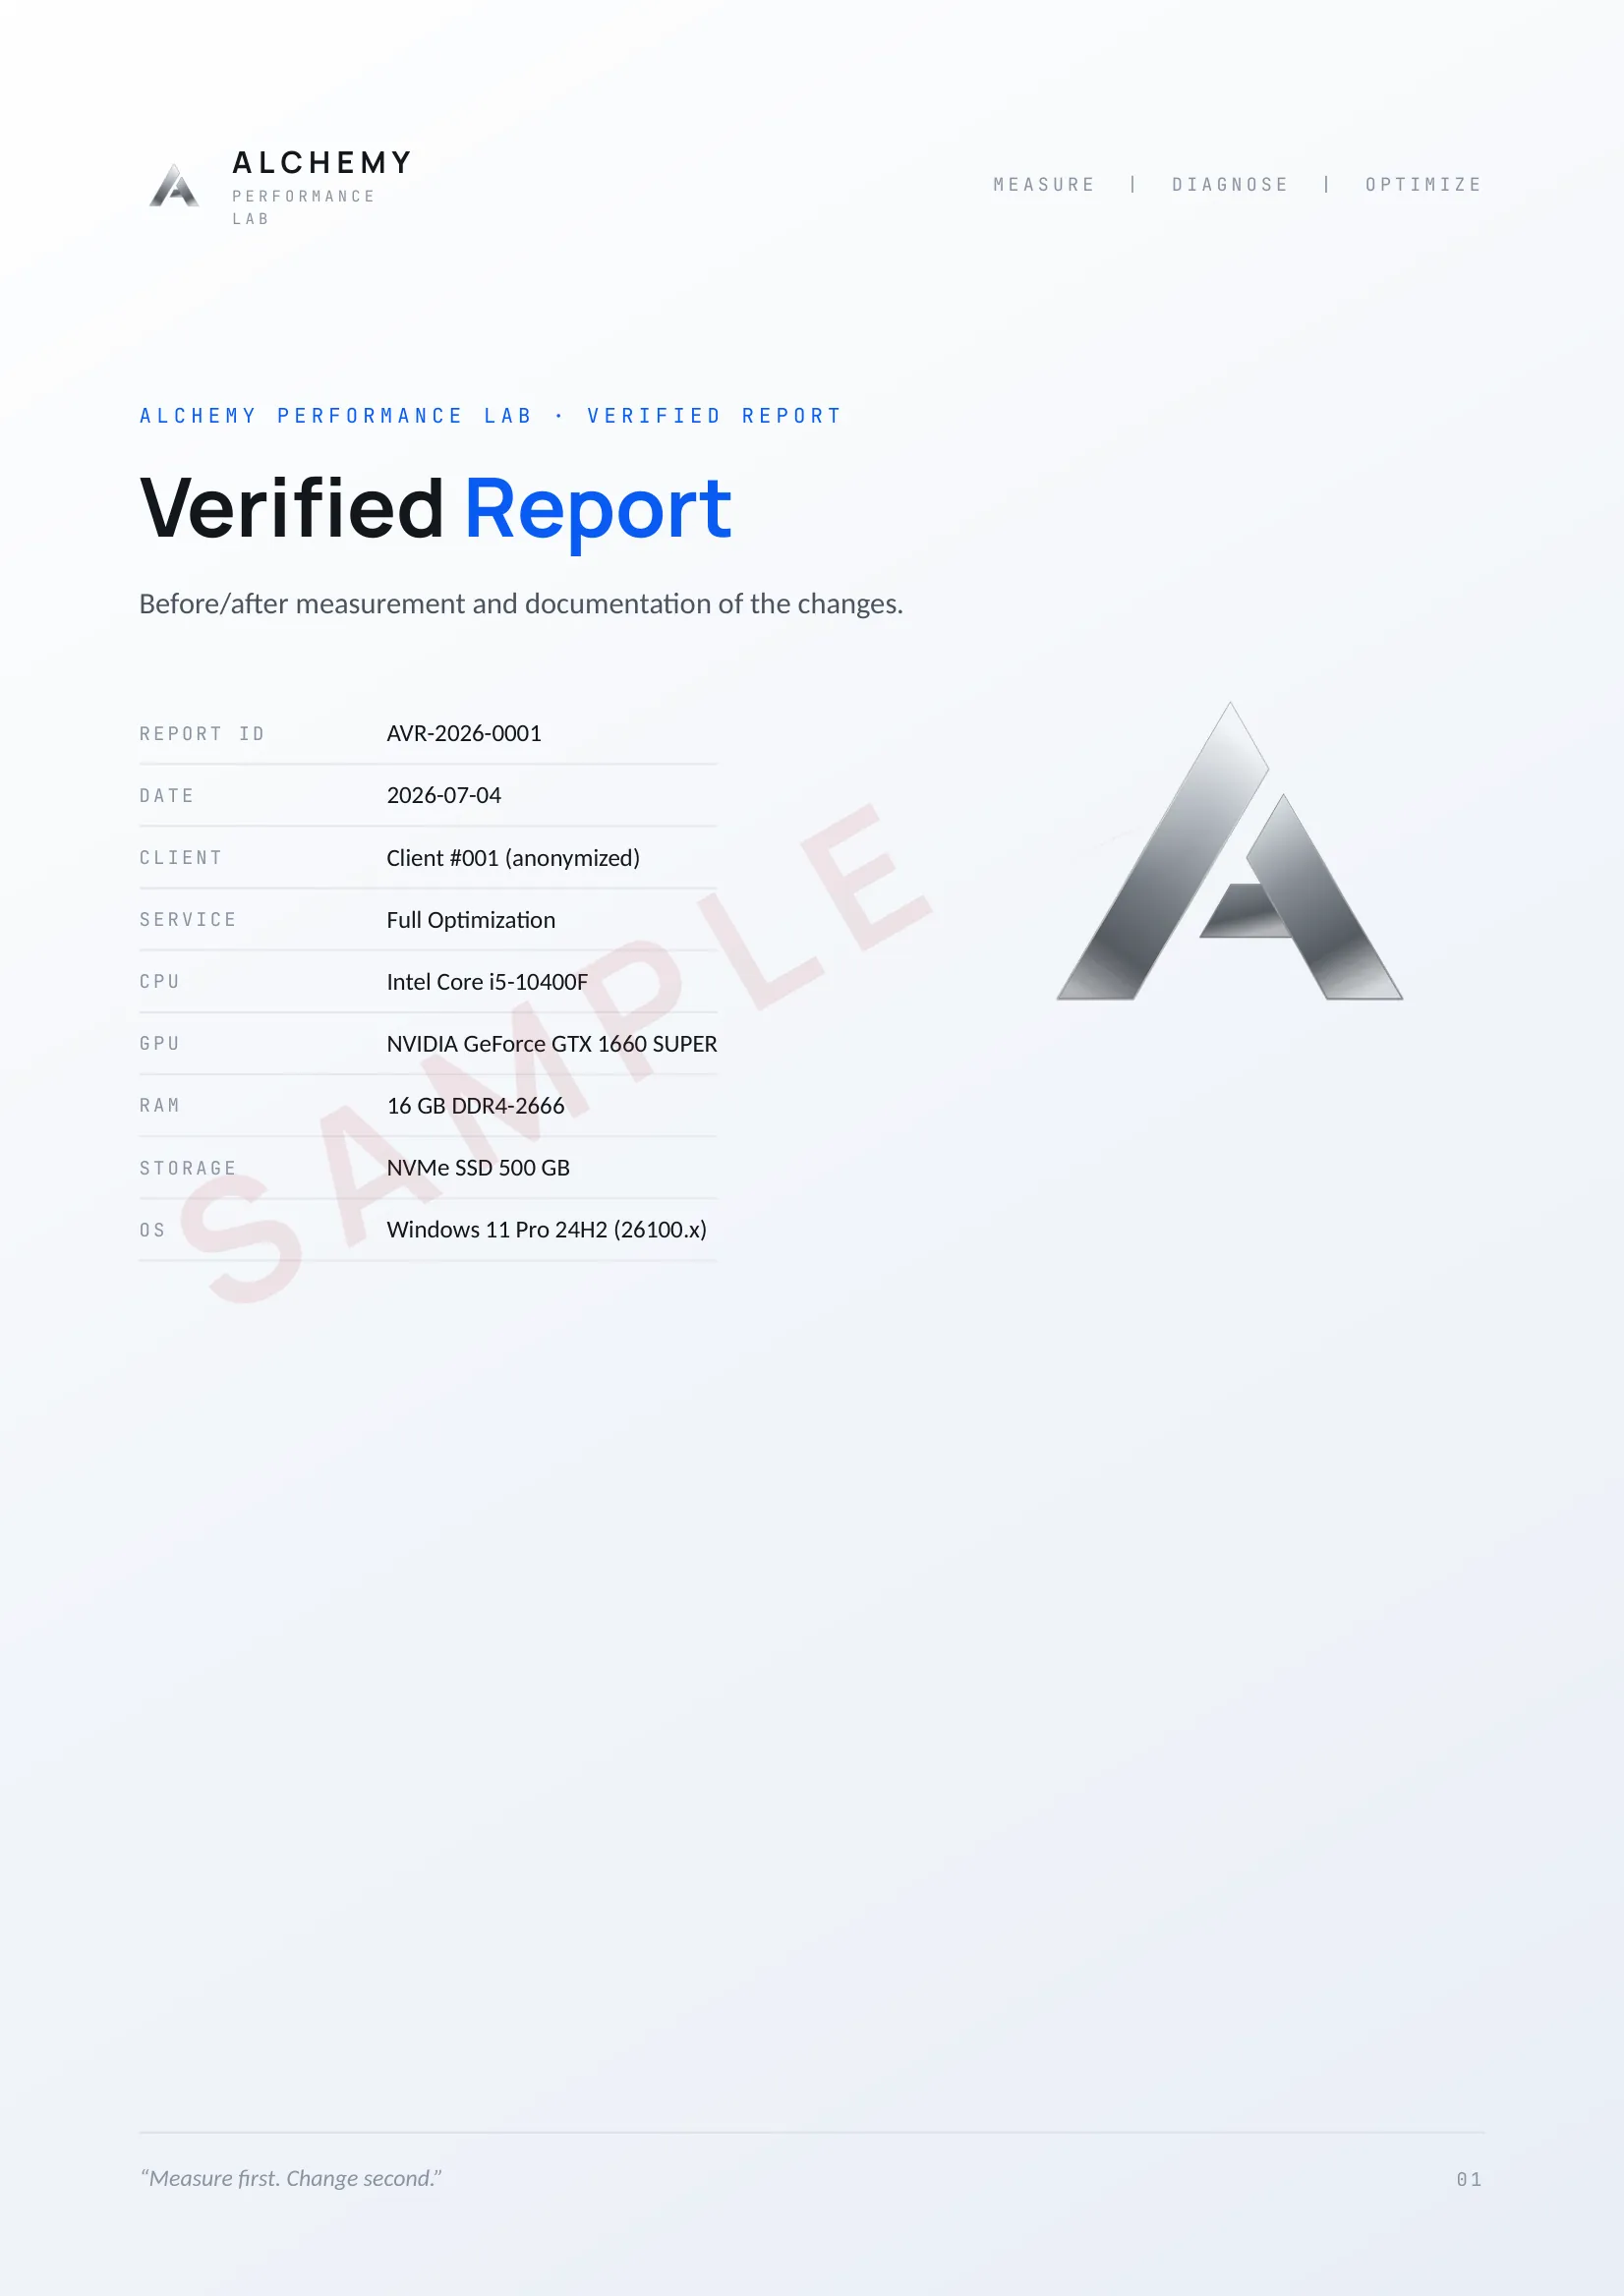
Measured system: Intel Core i5-10400F · NVIDIA GeForce GTX 1660 SUPER · 16 GB DDR4-2666 · NVMe SSD 500 GB · Windows 11 Pro 24H2 (26100.x)
Conditions: 20 runs per side, 3 warm-up runs excluded. Evidence threshold: |Δ| ≥ 1.5 × pooled_stddev AND |Δ%| ≥ per-metric floor (calibrated). Same before/after conditions: same power plan during measurement, a 10-minute idle normalization period followed by a pre-capture system-state check, network inactive, same driver versions unless the driver change is part of the intervention.
01System details
Includes the date, report ID, and the main hardware and Windows details of the system that was measured.
02Measurements and results
Shows the key measurements, the before/after comparison where applicable, and a short conclusion on what changed in practice.
03Changes and rollback
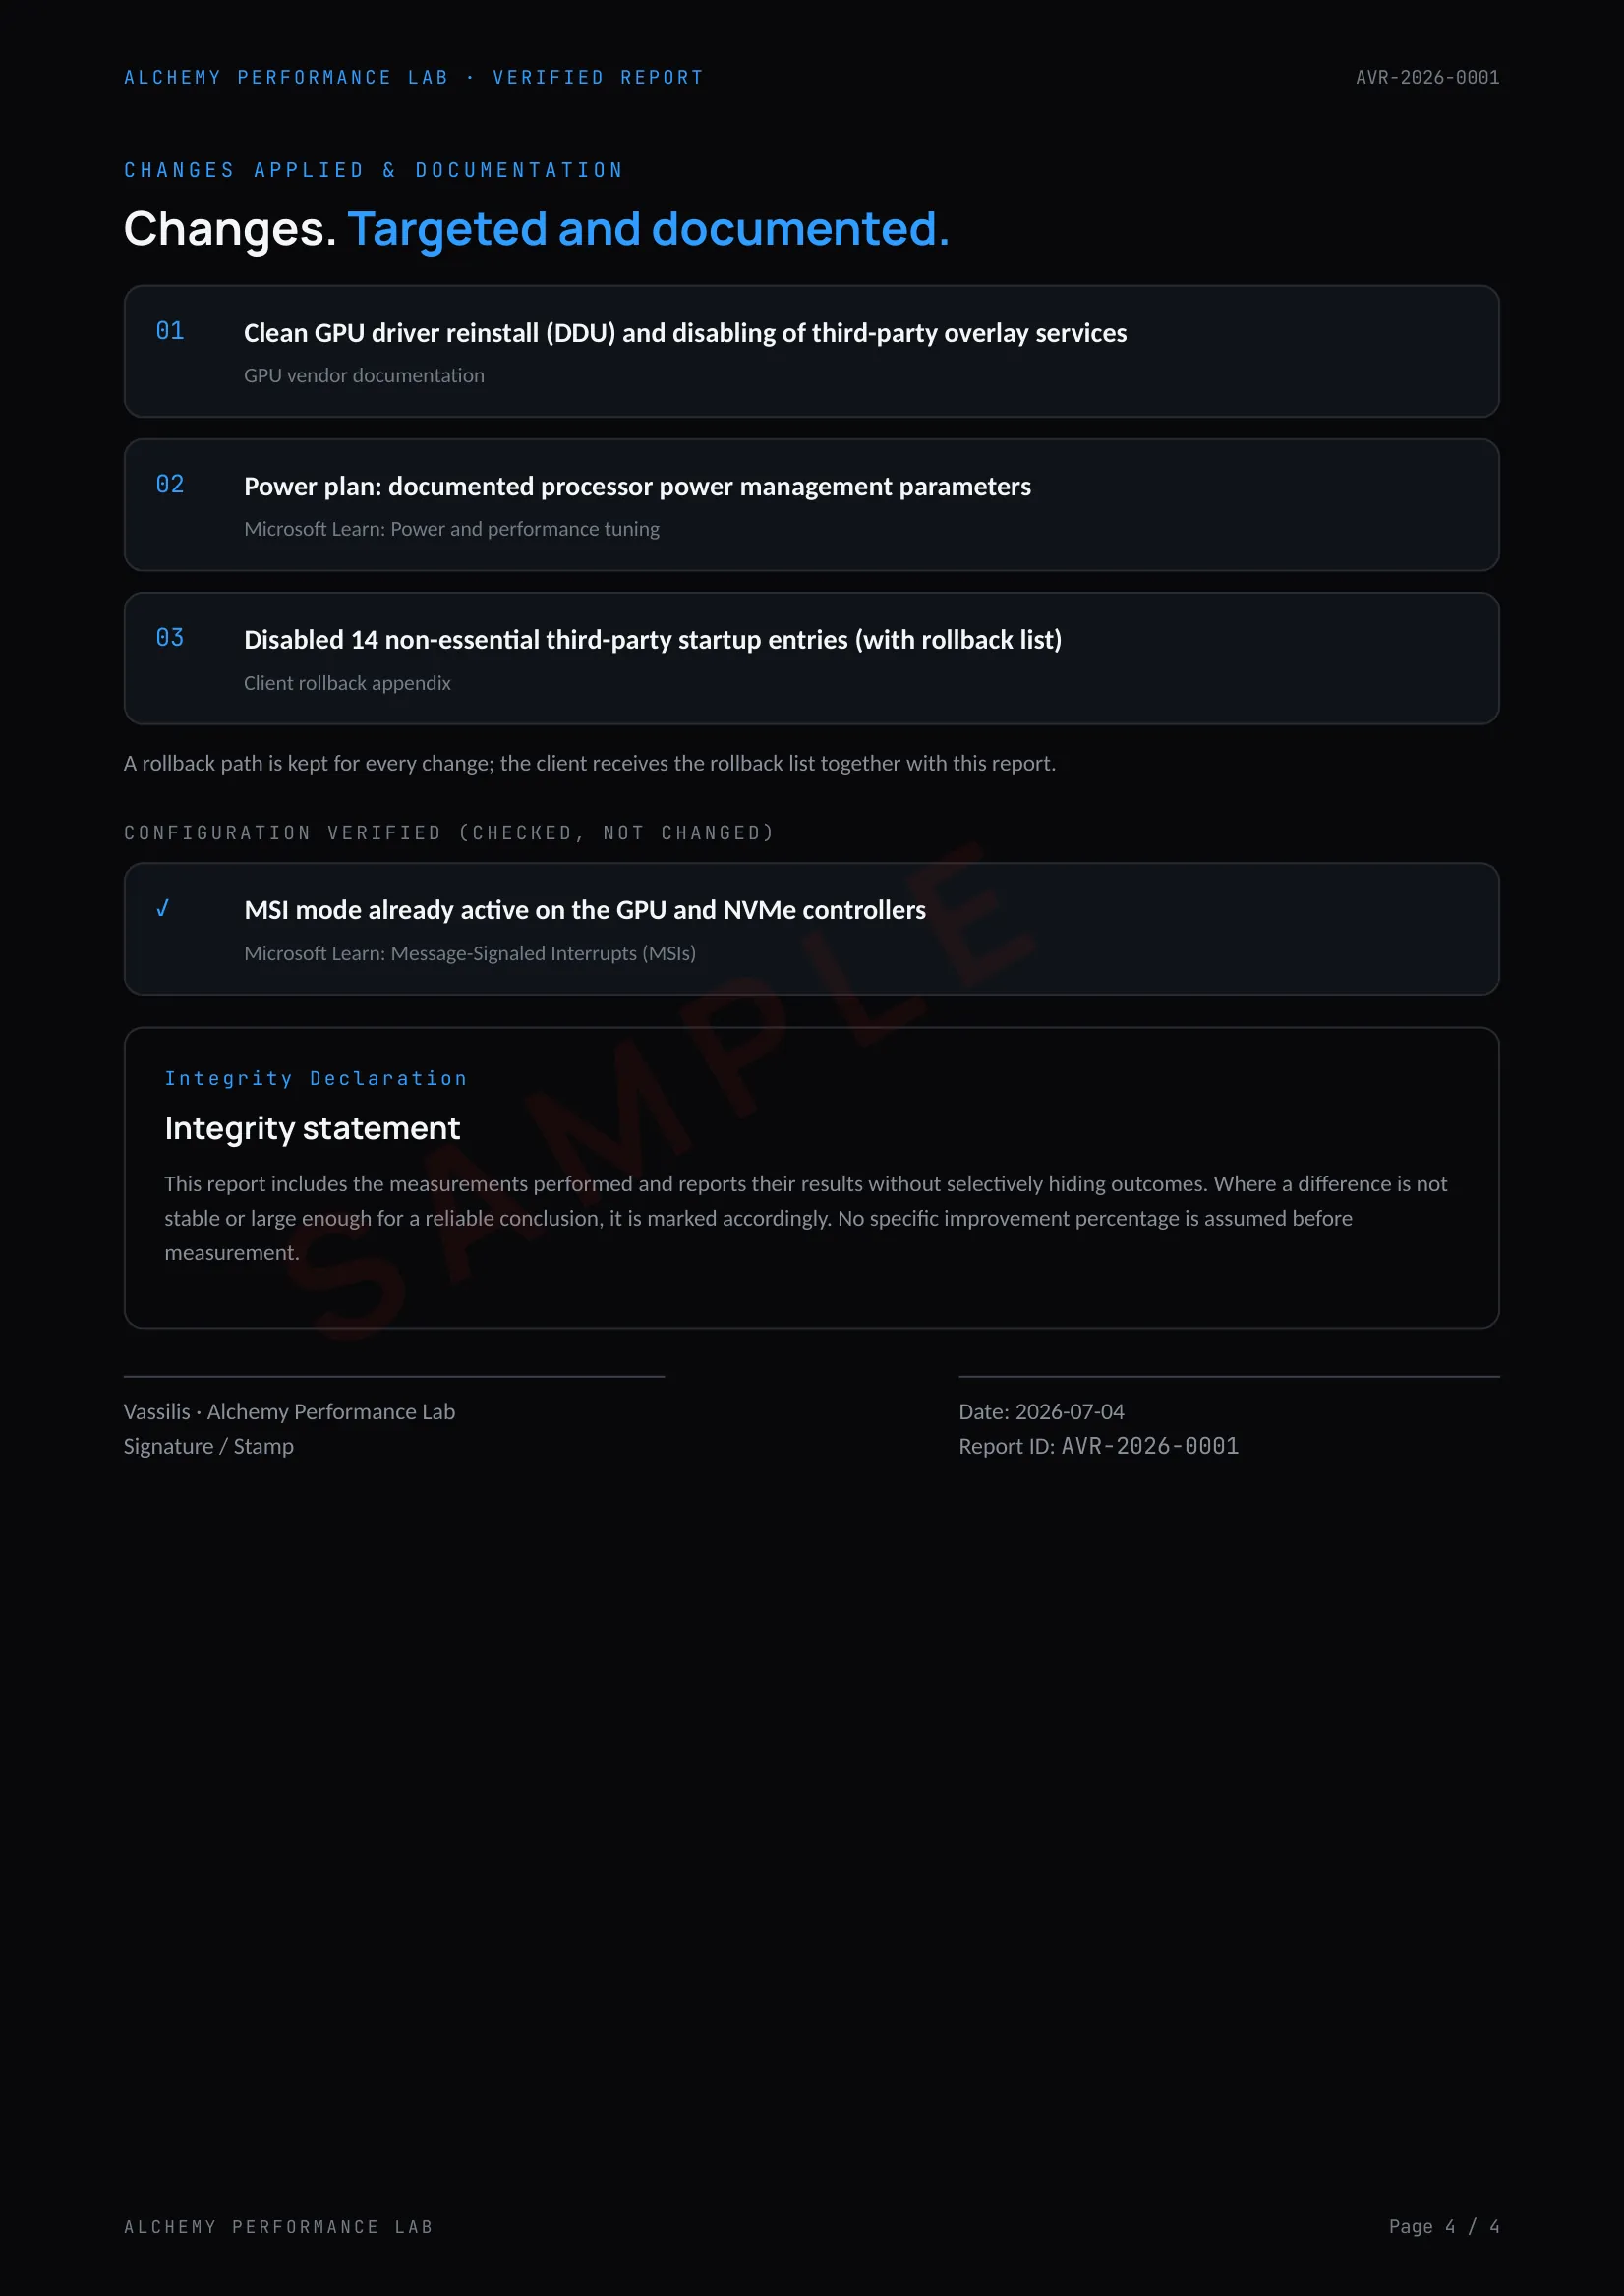
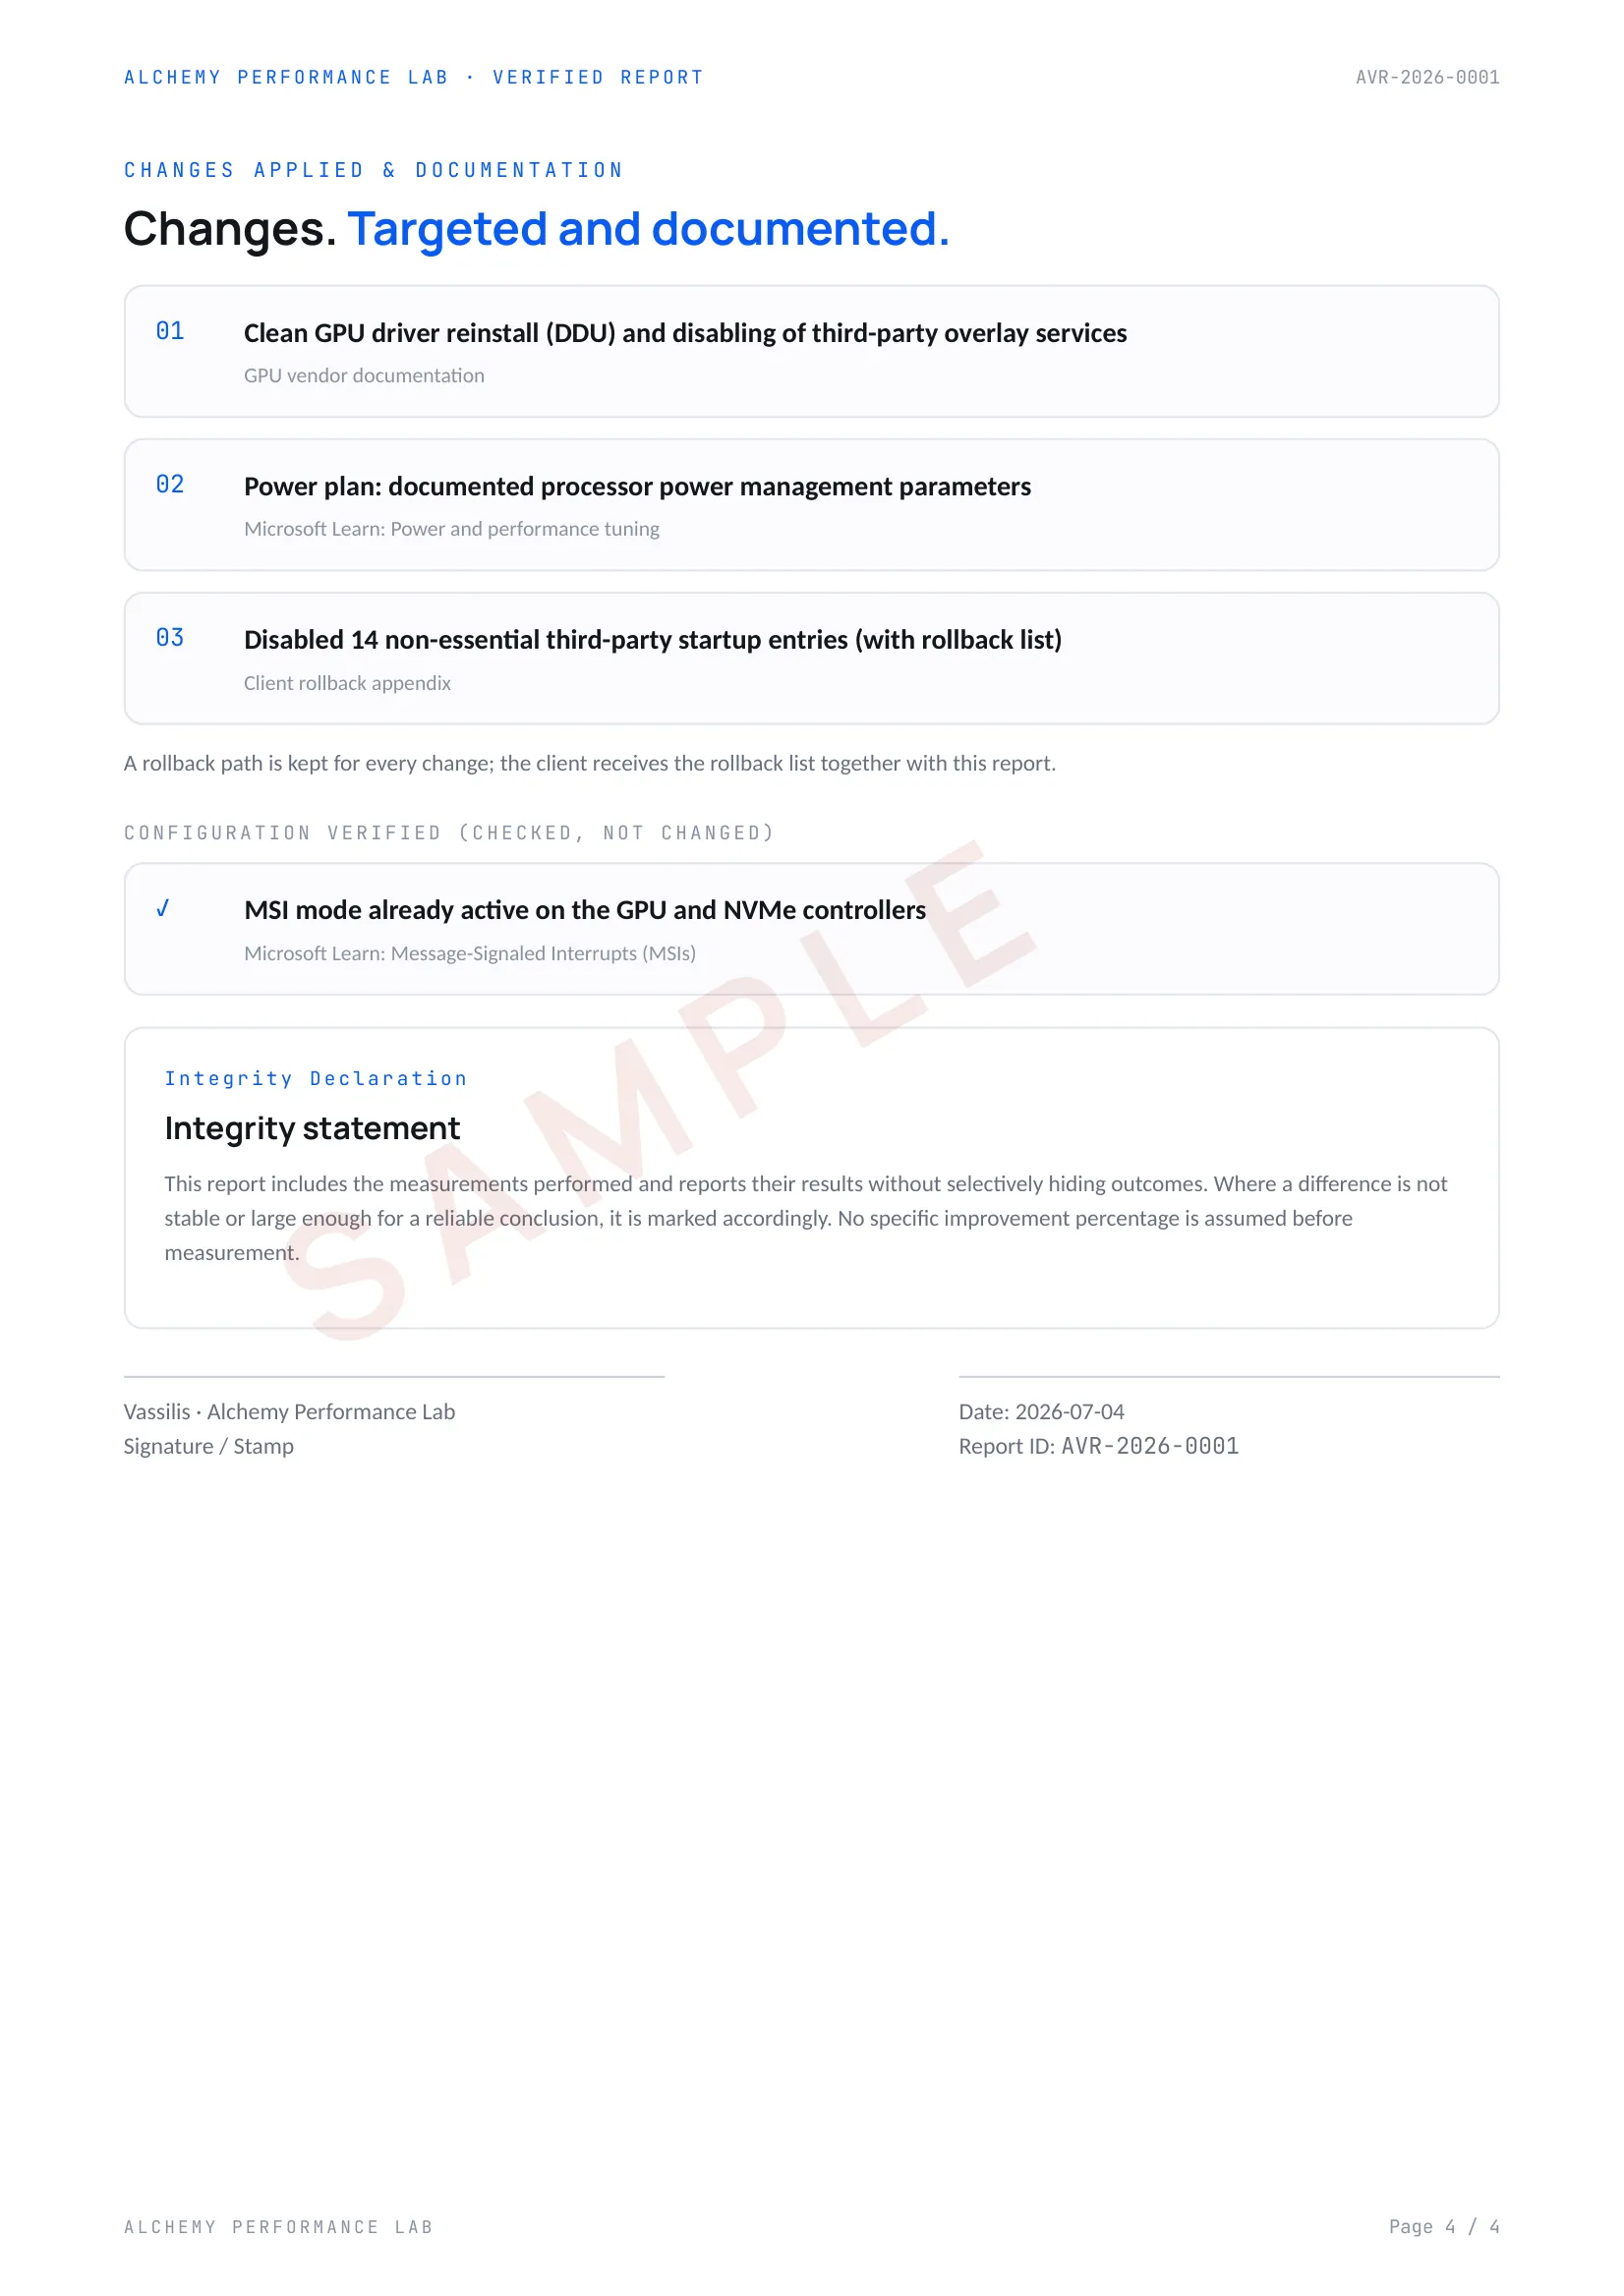
For Full Optimization, every applied change is listed with its source and how to reverse it. Settings that were only checked and found already correct are listed separately, because verifying a setting is not the same as changing it.
04Game results in the report
When games are the workload, in-game captures are reported the same way: average FPS, 1% low and frametime percentiles (P95 / P99), before and after, each with its own verdict. The sample above shows the system benchmark suite only; game results depend on the title, settings and scene, so they are reported for your workload rather than as a general claim.
One report. A clear view of the result.
Sample report. The figures illustrate the format and the verdict logic; they are not measurements from a real client.
Want to know what is actually limiting your system?
MEASURE → DIAGNOSE → OPTIMIZE